
Always keep a down payment in cash? The data disagrees.
The rule holds if you know when you'll buy. Many people don't, so I ran the numbers.

The standard advice goes: Keep a down payment in cash if you are buying a house in the next year or two.
And that’s right.
As long as you know when you’ll buy.
But what if you don’t?
What if you don’t even know if you’ll ever buy a house?
I’ve been in this position. I rented for years. It wasn’t a perfect apartment, but it was a great deal in a neighborhood we loved.
Renting made financial sense, but we still wanted to own. We started looking in 2018.
After looking at several places, we didn’t find anything we liked at a reasonable price, so we paused the house hunt.
We weren’t sure when we would look again.
That put us in an awkward position. What should we do with all this cash waiting for the day we might need it for a down payment?
Nothing I’ve read has really answered this question. People simply repeat, “Don’t take any risk with a down payment,” but without any real evidence.
I set out to answer this question by looking at the historical data.
Specifically, should you invest part of a down payment when:
You aren’t sure when you’ll buy, but it probably won’t be in the next year or so? Or,
You’re not sure if you even want to buy at all?
Case study: $100,000 / 20% down.
Let’s imagine a person in this situation - we’ll call her Jess.
Jess has a down payment saved up but not sure if she wants to buy, at least not in the next few years.
Houses in her neighborhood are around $500,000. She has saved 20% down ($100,000). That’s a big chunk of her net worth.
Her top priority is building long-term wealth, and she is willing to accept some risk for a higher return.
Step 1: Establish a cash floor.
My first advice to Jess is to always keep 10% down in cash in a HYSA or MMF. That’s $50k. That ensures she can still buy with good credit with her 10% down (paying PMI) no matter what happens. Her future house is protected from an investment downturn.
Step 2: Should she invest the rest?
Let’s look at three ways she might invest the $50k above her cash floor:
50/50% Cash and Bonds: $50k cash floor and $50k in bonds,
50/25/25% Cash, Bonds, and Stocks: $50k cash floor, $25k in bonds, and $25k in stocks
50/50% Cash and Stocks: $50k cash floor, $50k in stocks
Risk and reward by how long the money sits
Let’s turn to the last 100 years of history to see how each of these portfolios would have performed.
We need to look at multiple timelines because Jess doesn’t know when exactly she’ll buy. She wants to know the potential risk and return in the future at various times she might decide she wants to buy.
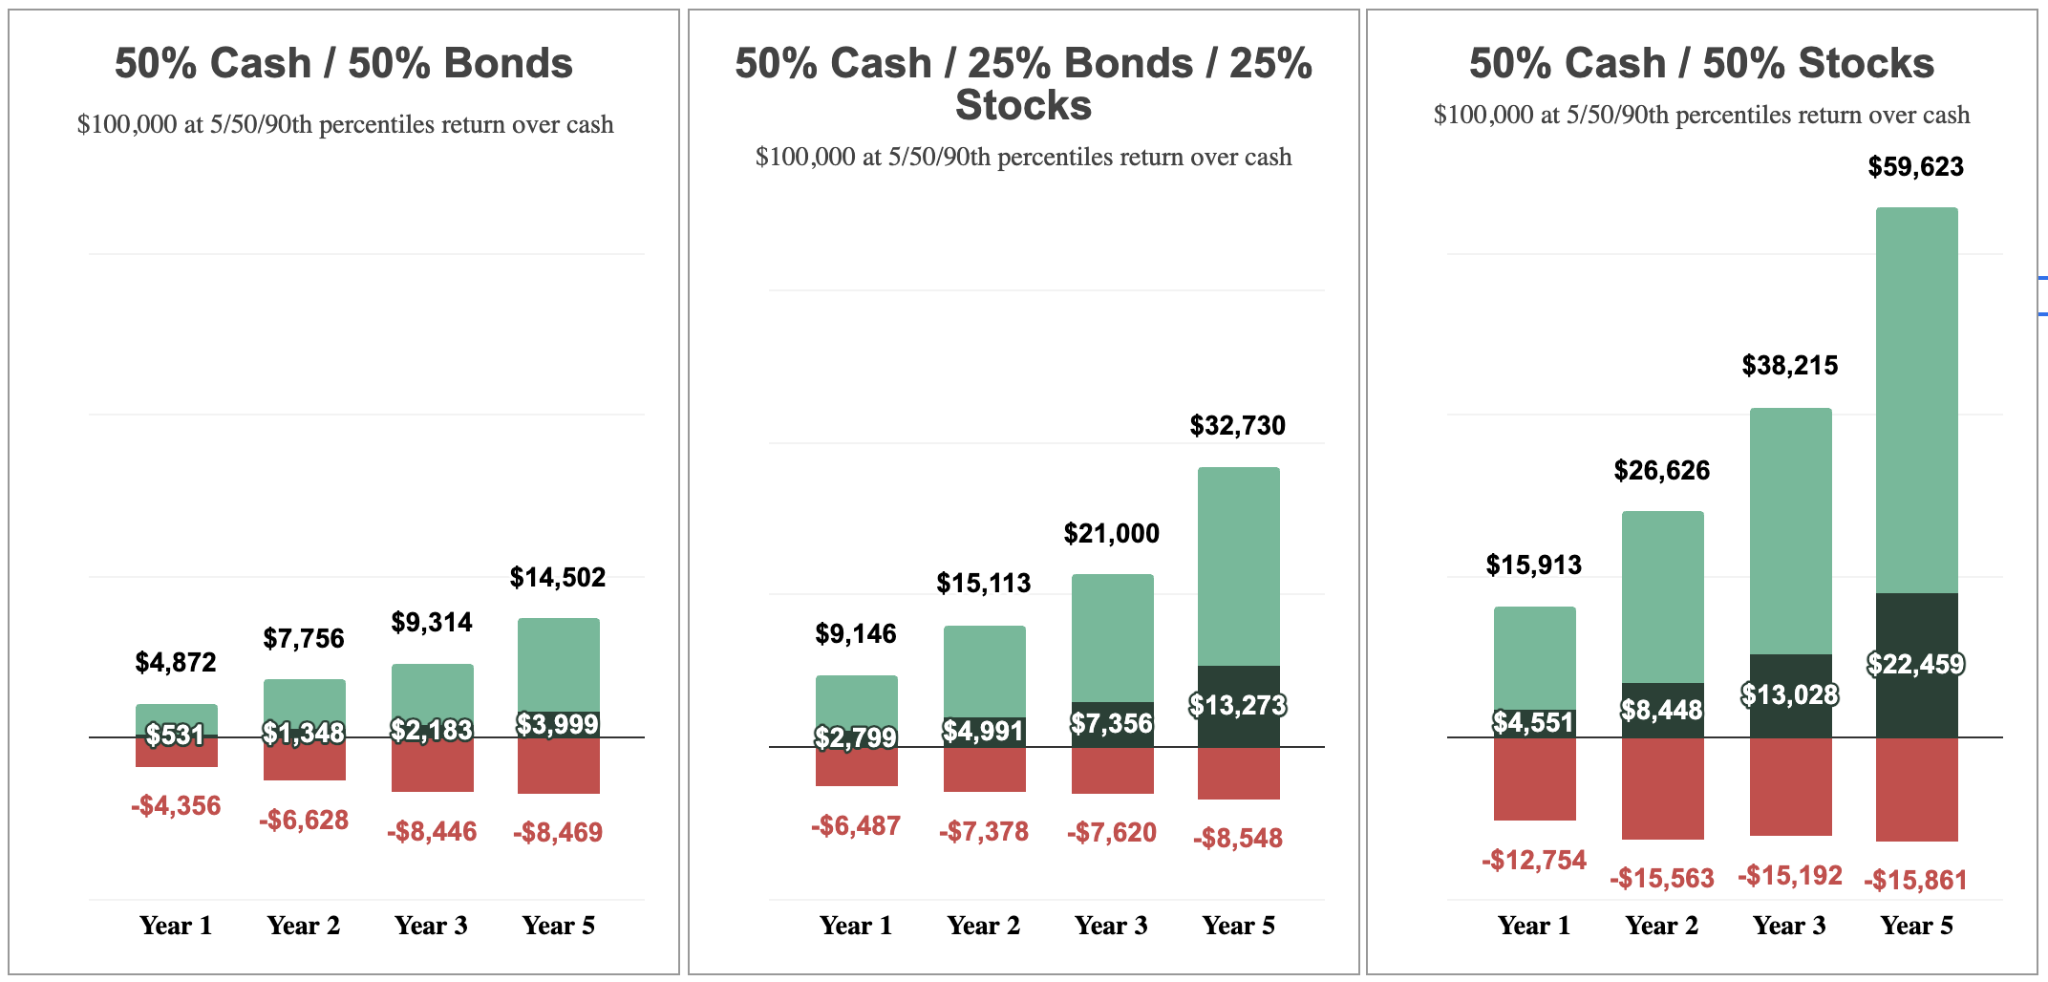
Here’s how they would have performed. Each bar shows the return on $100,000 at 1, 2, 3, and 5 years later.
Within each bar, there are three values: the worst 5% of returns historically, the median return, and the top 10% returns. That gives us a full range of what could happen after each time period1.
They all show real returns above or below holding the money in cash, representing only the extra amount you would expect to earn or lose compared to leaving it in the bank.

Years 1-2
The standard investment advice is to hold funds in cash if the timeline is less than two years.
That makes sense given the historical data.
In years 1 and 2, the possible loss is significant, and we don’t see much expected growth at the median return. Even the top 10% of cases don’t gain you much compared to what you could lose in a worst-case scenario.
The risk doesn’t seem worth it.
Years 3-5
In years 3-5, the gains in the median and top 10% cases grow quickly. The growth potential of stocks shows up in the second two portfolios.
Meanwhile, the losses in the worst-case scenarios change very little.
So, when we add stocks to the portfolio, we see growing upside potential and a flattening downside.
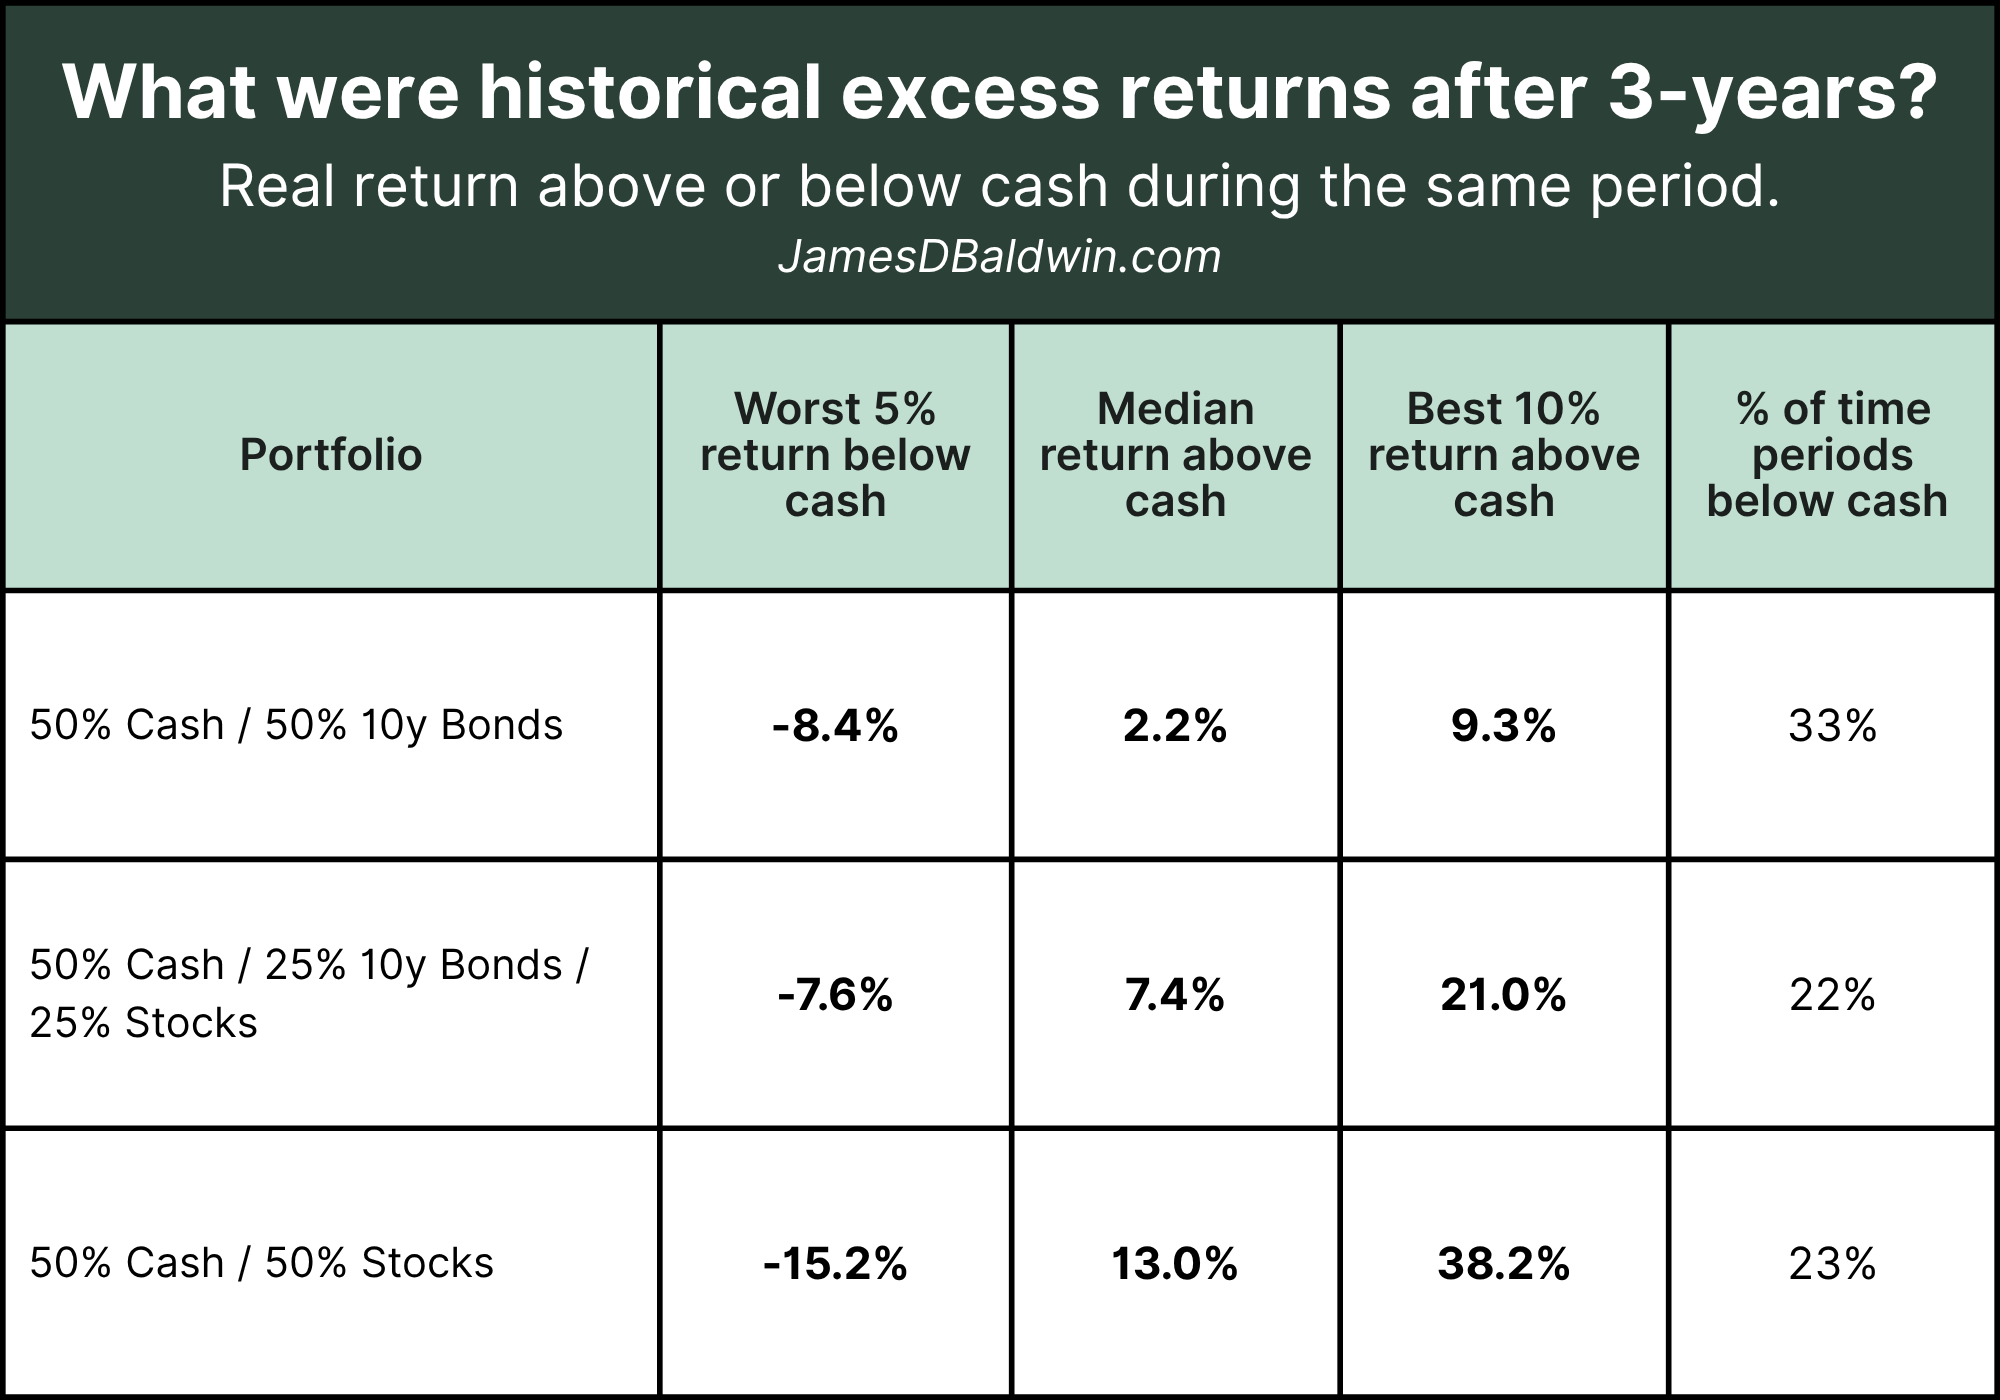
The verdict?
The middle portfolio with 50% cash, 25% bonds, and 25% stocks has a pretty attractive return profile to me for someone in Jess’ situation, especially if home purchasing may be still a while in the future.
Because we’re protecting 10% down by keeping it in cash, we’re mitigating the risk we care most about: the risk we can’t buy at all.
That being said, the choice will come down to how likely it is that you will buy in less than 3 years, and whether you are comfortable putting less down if you end up with a portfolio that’s lost some money.
But what does it mean for today’s market?
That’s a good question.
Is there anything about today’s market or economy that makes investing a better or worse option?
Let’s again look at what history tells us.
This chart shows the total return above cash on the 50% cash, 25% Bonds, 25% stock portfolio after 3-years.
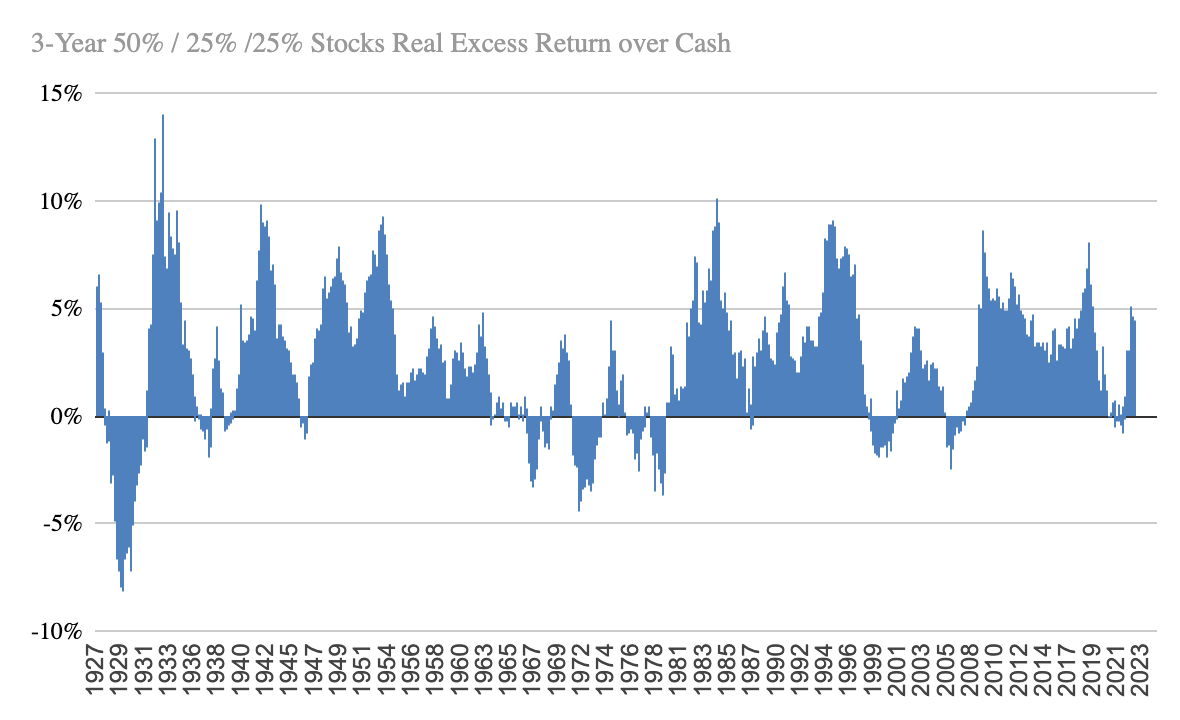
Investing did worse than holding cash in recessions: the 1929 Great Depression, 1970s stagflation, the 2000 dot-com bubble, and the 2008 Global Financial Crisis.
But in all other periods of history, investing did quite well.
How did cash do historically?
We haven’t yet looked at how cash would have performed on its own.
History shows that cash is not risk-free.
Cash lost purchasing power to inflation in 45% of 3-year periods in the last 100 years.
Let’s look at the total return of cash vs. the same portfolio.
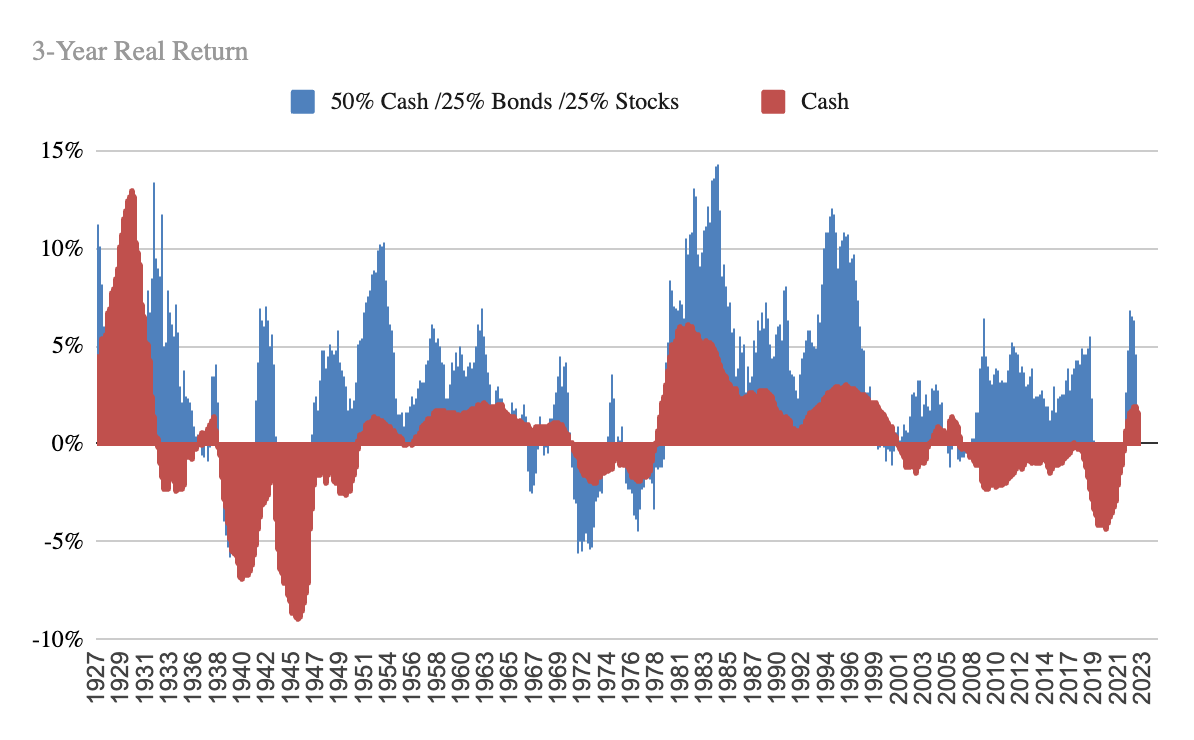
Cash does indeed tend to have lower risk, but also lower growth than the investment portfolio.
The big exception being the World War II period and 2010s, when interest rates were kept very low and cash did not keep up with inflation.
Conclusions
For those still debating if and when you will buy a house, it’s worth considering investing part of your down payment.
On the one hand, you accept some risk that your investment might be down in the short term. On the other hand, you maximize your potential to grow your wealth if you don’t end up buying soon.
If you do invest, make sure you’re protecting yourself by keeping enough in cash so that you can buy if you change your mind at the same time the market is down.
Technical notes on the analysis: I’m using Early Retirement Now’s assembled data set using returns for the S&P 500 and 10-year Bonds (Treasuries) going back to 1927. Ideally, we would use 3-year bonds to match the investing timeline, but I don’t have that data going back 100+ years. As a result, this slightly overstates the risk of the bond investments. If anyone has a data set of short-term bonds, please send it my way!
The numbers are pre-tax. Taxes would widen the gap in favor of stocks, since cash and bond interest are taxed as ordinary income while stock gains are deferred and are taxed at lower long-term rates.
These figures are adjusted for general inflation. If home prices rise faster than inflation, you would need a larger down payment as time goes on.
Historical data uses overlapping historical windows, which somewhat distorts the statistical analysis when looking at percentiles. I have also performed an analysis using a sampling methodology which provided slightly different values but directionally similar results.