
Can you beat the "Warren Buffet" portfolio? I tested myself.
I share my actual returns from the last 10 years. Did I beat Buffett?

Can you beat the Warren Buffett Portfolio? Can I?
In a 2013 shareholder letter, Warren Buffett recommended a portfolio of stock and bonds that he thought was the best option for any typical investor.
He believes in it enough to make it part of own his financial plan.
“My money, I should add, is where my mouth is: What I advise here is essentially identical to certain instructions I’ve laid out in my will. … Put 10% of the cash in short-term government bonds and 90% in a very low-cost S&P 500 index fund. (I suggest Vanguard’s.) I believe the trust’s long-term results from this policy will be superior to those attained by most investors – whether pension funds, institutions or individuals – who employ high-fee managers.”
The Buffett Portfolio is:
90% S&P 500 Index Fund (the 500 biggest U.S. companies). Like this fund at Vanguard.
10% Short-Term U.S. Government Bonds. Like this fund at Vanguard.
Here’s how that portfolio has grown over the 10 years through September 2024. This assumes starting with $10,000 and contributing $500/month1.
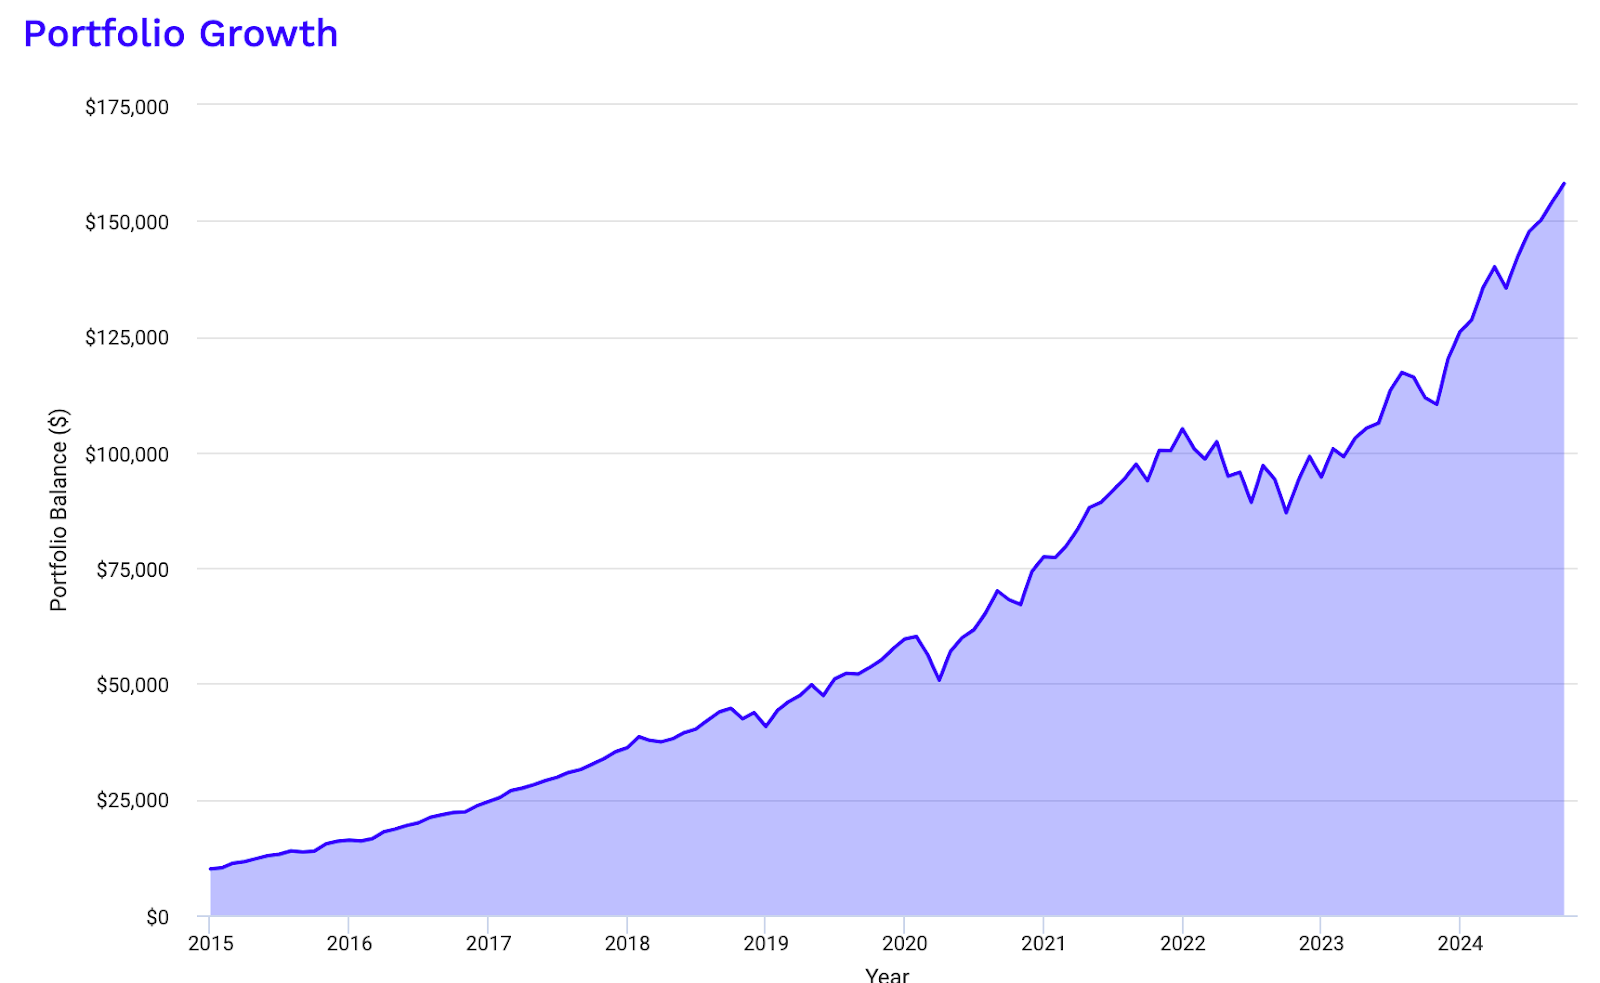
Over the last 10 years, the Buffett Portfolio has returned 13.80%.
Over the last 5 years, the Buffett Portfolio has returned 15.12%.
How does my strategy compare to Buffett’s?
My investment strategy follows Buffett’s principles. I buy mostly U.S. stock index funds and U.S. bonds. The main difference is that I invest in some international index funds and prefer total market funds over S&P funds. That gives me more diversification by including smaller and international companies in my portfolio.
My stock-to-bond mix has varied over the last 10 years, but the bulk of my Vanguard portfolio is similar to the 90%/10% split that Buffett recommends.
My Fidelity Account has a lower stock allocation. Currently, the portfolio is 75% stocks and 25% bonds. (As an aside, Bonds are best placed in your traditional 401k accounts, as I explain in detail here.)
How did my portfolio do over the last 10 years?
Here are my actual returns. I will share the two primary components of my portfolio separately because they are in different accounts, and it’s not feasible to combine the returns.2
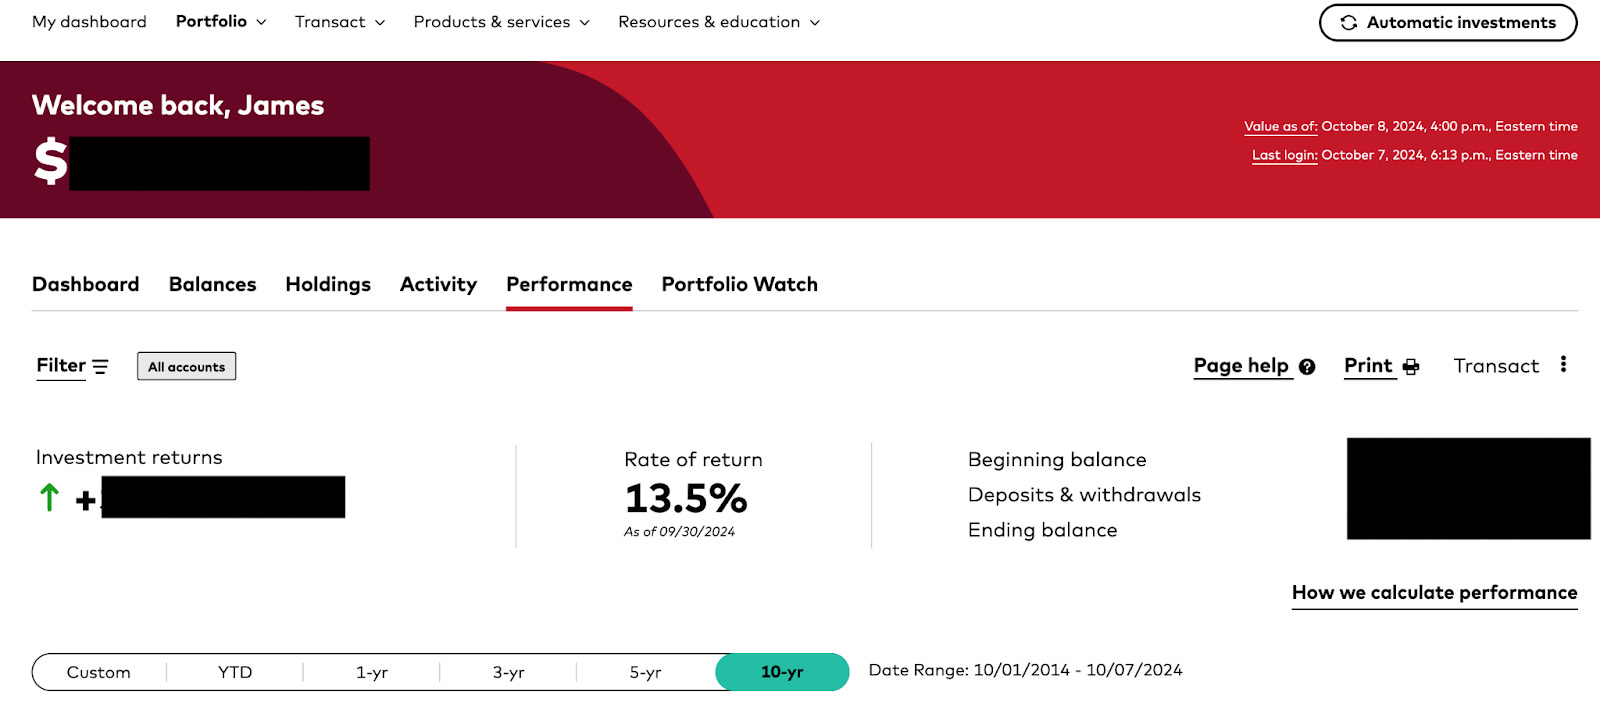
Over the last 10 years, my Vanguard portfolio has returned 13.5%. That’s a tiny bit worse than the Buffett portfolio (-0.3% less than 13.8%3).
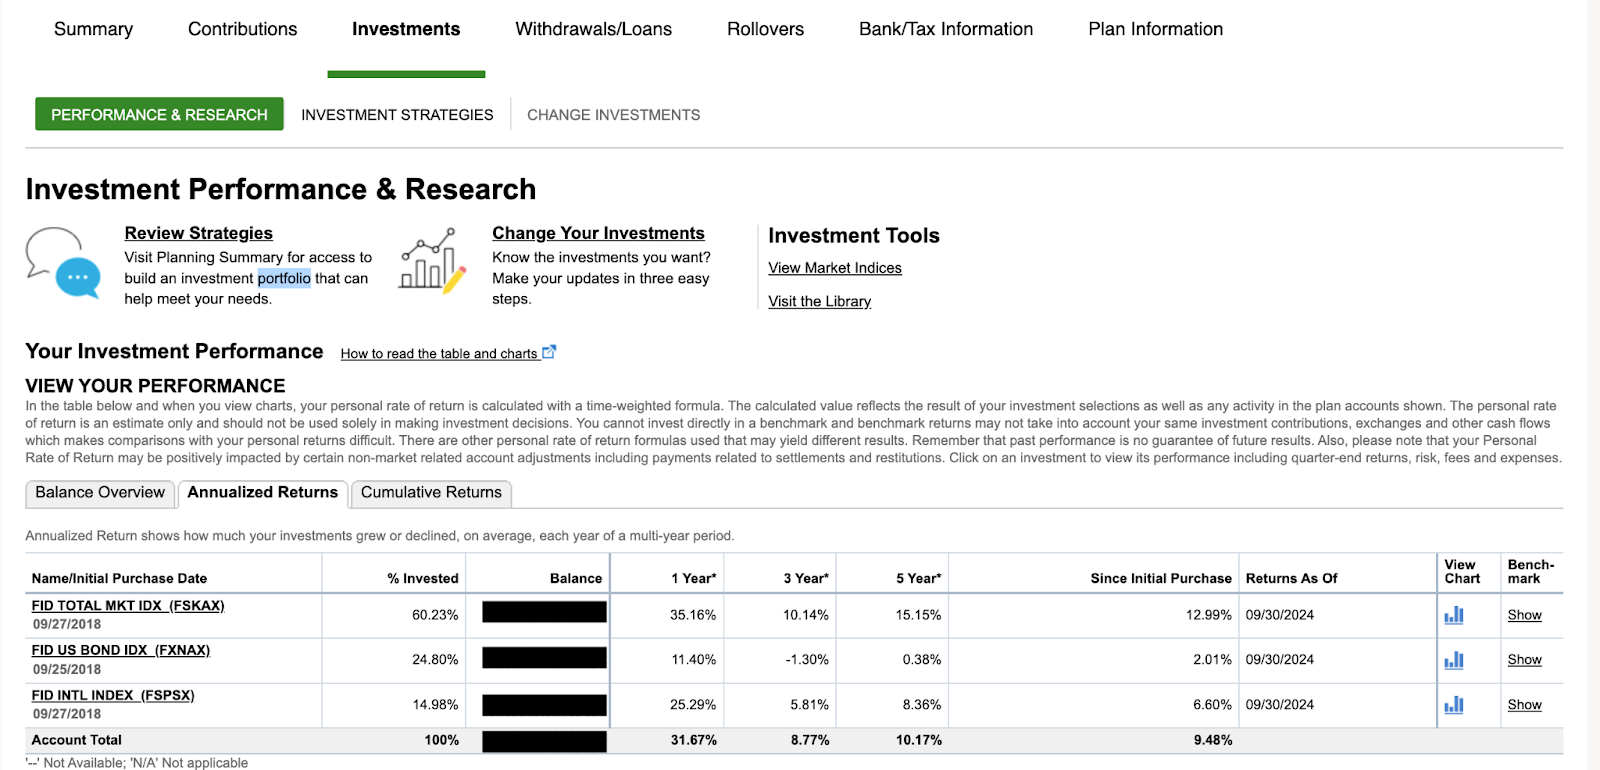
The returns in my smaller Fidelity 401k portfolio look a lot worse. I’ve returned 10.17% over the last five years. While 10% annual returns sound great, they’re 5% less than the Buffett Portfolio's 15.12%!
When you compound that difference over time, it’s enormous.
Takeaways: What drove the differences?
In practice, the return in my Vanguard portfolio is not significantly different than Buffett’s. I am more diversified with small and international companies. Bigger U.S. companies performed better over the last few years, so my return is slightly lower. I feel pretty good about that small tradeoff for more diversification.
Now, my Fidelity 401k account is very different. There’s a reason for that. I have a higher bond allocation. It’s currently around 25%, but has been lower in the past. I have slowly ramped up my bond allocation over time (that strategy is called a glide path4). That likely explains the bulk of the difference in why my return is lower; stocks have done amazingly well in this time frame.
Your turn. What’s your return been for the last 5 or 10 years?
How do you find your return?
In Vanguard, go to your dashboard and click the Performance tab.”
In Fidelity Net Benefits, go to Investments > Performance & Research > Annualized Returns.
Not all Platforms make this easy. But you should be able to hunt around and find something similar on most but not all platforms. (I wasn’t able to find it in Empower Personal Capital).
What’s your return? Does it surprise you? Can you make a reasonable guess as to why it’s done better or worse? Here are a couple of possible explanations that you can consider.
Do you have international stocks? They’ve done worse over the last 5 and 10 years than U.S. Stock. Buffett’s portfolio doesn’t hold them, which would lower your return relative to his over these periods. (But not necessarily in the future. Past performance is not a guarantee of future results!)
Do you have a higher (or lower) bond percentage than 10%? Higher would reduce your return (but lower your risk and volatility) than his because stocks have done so well recently.
Did you try to “Time the market”? How did that turn out? In the last 10 years, the stock market has almost only gone up (see the first chart), so holding onto cash and waiting for the right time to invest would generally have been worse than dumping the money into the market as soon as you had it. (Note: If you keep cash in a different account, like a savings account, the effect of timing the market will not show up in your automatically calculated returns, so you may have to guess the impact of those decisions.)
Did you go big or dabble in individual investments (e.g., $GME, Crypto)? Depending on the exact investment, that could have been good or bad. Buying Bitcoin 10 years ago would have been amazing. Buying in April 2021 would not have been amazing. Bitcoin had close to 0% return in the last 3 years, compared to 13% in the Buffett Portfolio.
If you’re comfortable sharing, we’d love to hear from you by email or in the comments.
Why does this matter?
This comparison reminded me that beating a diversified portfolio of reputable companies is tough over the long term.
Buffett understands this deeply. In 2007, he made a famous bet with Protégé Partners, a hedge fund, that a simple S&P 500 index fund would outperform a basket of actively managed hedge funds over 10 years. The bet was for $1 million, which would go to charity. Buffett won handily. Over the 10 years, the S&P 500 index fund returned 7.1% annually, while the average return of the actively managed hedge funds was just 2.2%.
If you try to get fancy with your investing, it’s a good practice to periodically see if your extra effort is worth it. It’s hard to see the day-to-day results of your long-term efforts. I didn’t predict that my Vanguard and Fidelity portfolios would have had such a big difference in return based on not-so-large differences in the portfolio. That was an a-ha moment for me.
Warren Buffett gives good advice. Consider taking it.
Don’t get greedy. As my favorite Bond Villain says:
The Buffett portfolio assumes starting with $10k and contributing $500 per month. I include monthly contributions comparable to those of a typical investor who regularly contributes to their investment accounts. Although, the relative contributions for other investors will be unique and not apples-to-apples comparable. This comparison will only apply to those who make relatively regular contributions to their investments.
The returns you and I find in our accounts will be inevitable approximations from a subset of your total assets. Calculating your exact return is nearly impossible. One of the primary problems with pulling your return from a platform like Vanguard is that it will likely only include a portion of your portfolio. Although poorly, I look at the returns of the two major parts of my portfolio separately to get around it. I believe it’s helpful to look at these while understanding the caveats.
All rates noted in this post, and all posts, are annualized unless otherwise noted. Rates of return are shared on a Money-Weighted Rate of Return basis so that the effect of trying to ‘time the market’ is factored in. There are other methodologies for calculating returns that would generate different annual rates.
Glide path: As the investor approaches the target date (such as retirement), the glide path progressively reduces exposure to these riskier assets and increases allocation to more conservative investments like bonds or cash, aiming to protect the portfolio from market volatility.